Dow 36,000? Nope, Dow One Billion.

By now everyone is familiar with the parallels between the charts of the Nikkei and the US markets after the "Y2K Bubble" popped (as you shall see, we're using quotes for good reason). For quite some time it appeared we were bound to follow Japan into our own deflationary ring of hell. But as our markets refused to roll over, at some point it became clear, no matter how we adjusted the timelines, that the whole thesis was invalid.

More recently, this chart from Birinyi Associates (via Captain Kirk) has gained currency among investors, as it would happily suggest we are merely in the middle innings of a great bull run.
However, sadly, we must reject this comforting image due to a variety of technical factors which we uncovered during our own computer runs of the data.
In fact, you might be surprised to find Birinyi Associates understated the outcome by a factor of 80,000!
It is those technical factors that led FinancialRx to what we believe may prove to be the most significant development in finance since the invention of compound interest.
Ironically, this simple model has resided under our noses for 10 years now.
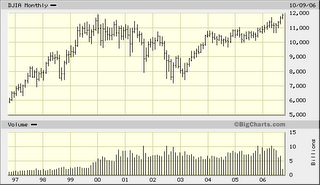
Witness: The next two charts compares the Dow Jones Industrial Average with the cumulative earnings of Tiger Woods since he turned Pro. (Second chart courtesy Golf Digest Magazine.)


As you can clearly see both bear an uncanny resemblence, right down to the 2000-2002 dip in the Dow, which of course encompasses Tiger's adoption of a new swing. Other mini-corrections correlate to Tiger falling in love, Tiger changing caddies (which we have previously mistaken for the "Asia Crisis" and then the "LTCM Debacle"), and so on.

With the help of the supercomputers and staff at the Bureau of Labor Statistics, we have backtested, adjusted the model to smooth for seasonality, added birth/death adjustments, tweaked the confidence interval, and rounded up all numbers in each sequence, in order to obtain the perception that our projections are correct.
Other than normal future revisions and changes in calculation methodologies, the only thing that could possibly derail such an obvious outcome would be... well... Tiger Woods.
Bottom line: Dow One Billion by 2010.
Naturally, certain naysayers will raise questions:
Inverted Yield Curve? Don't make me tired.
Korean peninsula hanging over Japan like a Nuclear Sword of Damocles? Mixed metaphors are not an investing strategy.
Runaway twin deficits in an asset based economy? Makes me bullish just thinking about it.

0 Comments:
Post a Comment
<< Home